In a study of the relationship between amount of sugar consumed (X) and excitability (Y) in children,the regression equation was calculated to be 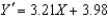 .The amount of sugar consumed ranged from 1 to 4 ounces.Which of the following graphs correctly displays the regression line?
A) Graph A
B) Graph B
C) Graph C
D) Graph D
Correct Answer:
Verified
Q26: Homoscedasticity occurs when
A)there is a nonlinear relationship
Q27: A nutrition major at State University was
Q28: If the correlation coefficient turns out to
Q29: The standard error of the estimate is
Q30: The "error" in a single prediction is
Unlock this Answer For Free Now!
View this answer and more for free by performing one of the following actions

Scan the QR code to install the App and get 2 free unlocks

Unlock quizzes for free by uploading documents