The figure shows the number of days to first flowering in populations of mustard plants before the 2000-2004 drought (on the left, in pale gray) , after the drought (on the far right, in dark gray) , and of hybrids between the before-and-after populations. According to this figure, which of the following statements is true? 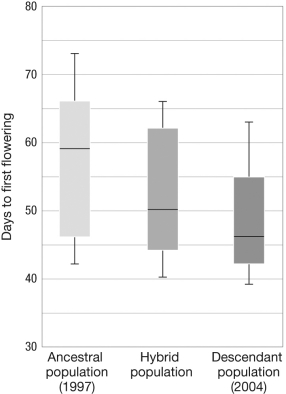
A) After the drought, plants flowered earlier in the season than those from before the drought.
B) After the drought, plants flowered later in the season than those from before the drought.
C) Hybrid plants flowered later in the season than those from before the drought.
D) There was no change in flowering time associated with the drought.
Correct Answer:
Verified
Q15: The figure shows the norm of reaction
Q16: Natural selection is a process that results
Q17: What does a species' life history strategy
Q18: In order for traits to evolve by
Q19: Why was it informative for researchers studying
Q21: Considering the phylogenetic evidence of feather evolution,
Q22: Describe the three conditions that must be
Q23: Richard Lenski and his colleagues' long-term evolution
Q24: The figure below shows the number of
Q25: The figure illustrates a likely scenario for
Unlock this Answer For Free Now!
View this answer and more for free by performing one of the following actions

Scan the QR code to install the App and get 2 free unlocks

Unlock quizzes for free by uploading documents