What does the following graph illustrate? (PD is peritoneal dialysis.) 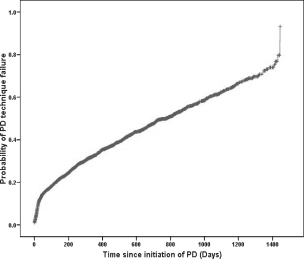
Correct Answer:
Verified
Q1: Which of the following is not a
Q1: How would you request a logistic regression
Q4: What does the log-likelihood measure?
A) The number
Q5: What does the Wald statistic represent?
A) The
Q6: What is an alternative to logistic regression
Q7: Large log-likelihood values do not show
A) The
Q8: Logistic regression
A) Estimates values in the outcome
Q11: Logistic regression is used when you want
Q16: The odds ratio is?
A) The natural log
Q17: In logistic regression, the dependent variable is
Unlock this Answer For Free Now!
View this answer and more for free by performing one of the following actions

Scan the QR code to install the App and get 2 free unlocks

Unlock quizzes for free by uploading documents