In their study of 'Using individual growth model to analyse the change in quality of life from adolescence to adulthood', Chen and Cohen (2006) conducted interviews on three different occasions over a period of time, and the following graph demonstrates the physical health changes noted over these three periods in 20 of their sample. 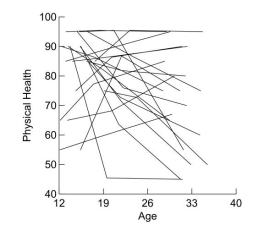 Individual Physical Health Change (raw data, n = 20)
What does the graph illustrate?
A) No evidence of variability in physical health scores.
B) Small inter-individual variability in physical health scores.
C) Large inter-individual variability in physical health scores.
D) None of the above.
Correct Answer:
Verified
Q1: What effect does 'centering' have on the
Q2: At age 23, what was the average
Q4: In a study of the analysis of
Q5: In a study of the Analysis of
Q6: In their study of 'Using individual growth
Q7: Which of the following was not a
Q8: What does the Estimates of Covariance Parameters
Q9: Which of the following is not an
Unlock this Answer For Free Now!
View this answer and more for free by performing one of the following actions

Scan the QR code to install the App and get 2 free unlocks

Unlock quizzes for free by uploading documents