Looking at the graph below, approximately what was the median success score for the nicotine group? 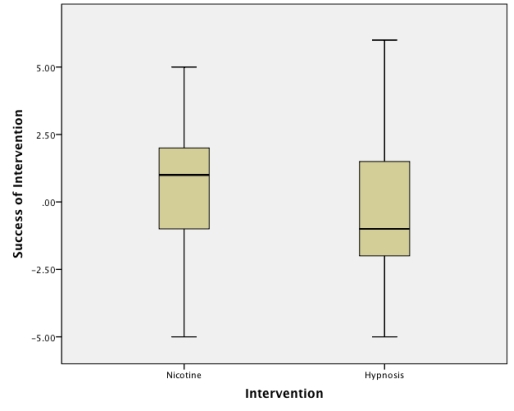
A) -5.00
B) 1.00
C) 2.00
D) -1.00c.
Correct Answer:
Verified
Q12: Looking at the graph below, which of
Q13: What does a histogram show?
A)A histogram is
Q14: Which of the following statements best describes
Q15: In IBM SPSS, what is this graph
Q16: Looking at the graph below, which intervention
Q18: What is the graph below known as?
Q19: A study was done to investigate the
Q20: What is this graph known as?
Q21: We took a sample of children who
Q22: We took a sample of children who
Unlock this Answer For Free Now!
View this answer and more for free by performing one of the following actions

Scan the QR code to install the App and get 2 free unlocks

Unlock quizzes for free by uploading documents