Compared with curve 2 on this hydrograph,what is a possible explanation for curve 1? 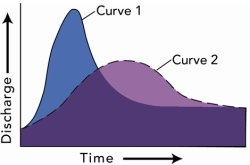
A) the basin for curve 1 has steeper slopes than the basin for curve 2
B) the storm recorded by curve 1 was shorter and more intense than the storm represented by curve 2
C) curve 1 shows the same area as curve 2 but after urbanization
D) all of these are possible
Correct Answer:
Verified
Q3: What is the pattern of discharge shown
Q5: What happens to water velocity downstream? It
Q6: What is a reasonable interpretation for the
Q10: What is the mostly likely setting for
Q12: Which event is best represented by the
Q13: What units of measure would most likely
Q24: Which of the following does NOT influence
Q28: Which of the following is true about
Q34: Which of the following is a condition
Q40: Which of the following sediment sizes is
Unlock this Answer For Free Now!
View this answer and more for free by performing one of the following actions

Scan the QR code to install the App and get 2 free unlocks

Unlock quizzes for free by uploading documents