The data below represents monthly sales for two years of beanbag animals at a local retail store (Month 1 represents January and Month 12 represents December).Given the time series plot below,do you see any obvious patterns in the data? Explain. 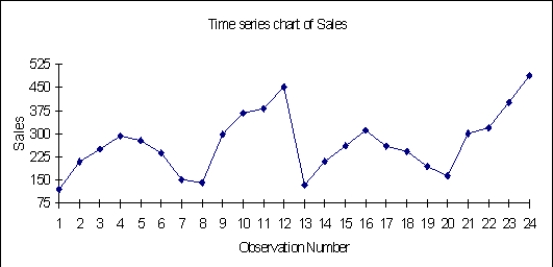
Correct Answer:
Verified
View Answer
Unlock this answer now
Get Access to more Verified Answers free of charge
Q66: Calculate the interquartile range. What does this
Q67: Suppose that an analysis of a set
Q69: How would you describe the salary of
Q81: The histogram below represents scores achieved by
Q84: Half of the job applicants scored below
Q90: Based on the histogram shown below,how would
Q91: Is the distribution of the number of
Q92: A question of great interest to economists
Q94: Based on the histogram shown below,how would
Q99: The histogram below represents scores achieved by
Unlock this Answer For Free Now!
View this answer and more for free by performing one of the following actions

Scan the QR code to install the App and get 2 free unlocks

Unlock quizzes for free by uploading documents