Refer to the accompanying graphs to answer the questions.
Graph A 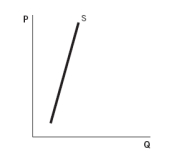 Graph B
 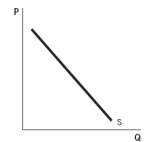 Graph C
 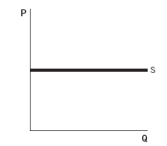 Graph D
 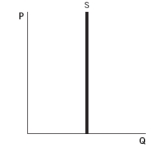 Graph E
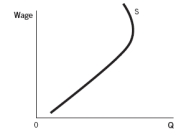
-Which graph shows a person who has a fixed quantity of hours that she is willing to work per week?
A) Graph A
B) Graph B
C) Graph C
D) Graph D
E) Graph E
Correct Answer:
Verified
Q25: The income effect describes the
A) incentive to
Q41: The backward-bending labor supply curve has its
Q43: Refer to the following graphs to answer
Q46: The accompanying table shows the supply
Q48: Refer to the following graphs to answer
Q51: When people make more money, they sometimes
Q53: When the opportunity cost of leisure is
Q54: When Josh's wage rises and he decides
Q57: Refer to the accompanying graphs to answer
Q60: When their wages rise,Bob works more and
Unlock this Answer For Free Now!
View this answer and more for free by performing one of the following actions

Scan the QR code to install the App and get 2 free unlocks

Unlock quizzes for free by uploading documents