The figure given below represents the business cycle of an economy. Figure 7.1 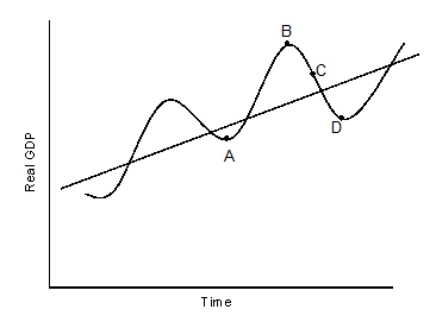 Refer to Figure 7.1.The movement from point A to point B in the figure is most likely to be associated with _____.
A) negative inflation rates.
B) an increase in the aggregate demand for goods and services.
C) lagging economic productivity.
D) an increase in cyclical unemployment.
E) a downward trend in leading economic indicators.
Correct Answer:
Verified
Q9: Unemployment data in the U.S.are published by
Q10: Which of the following is not a
Q11: Which of the following is observed in
Q12: Which of the following monthly data series
Q13: Which of the following signals the start
Q15: An increase in stock prices can be
Q16: Which of the following would be considered
Q17: The figure given below represents the business
Q18: Which of the following will be considered
Q19: Which of the following refers to business
Unlock this Answer For Free Now!
View this answer and more for free by performing one of the following actions

Scan the QR code to install the App and get 2 free unlocks

Unlock quizzes for free by uploading documents