Each of the panels given below represents the short-run equilibrium in the U.S.economy.The Aggregate Demand and Aggregate Supply curves in each panel responds to various economic changes. Figure 8.1 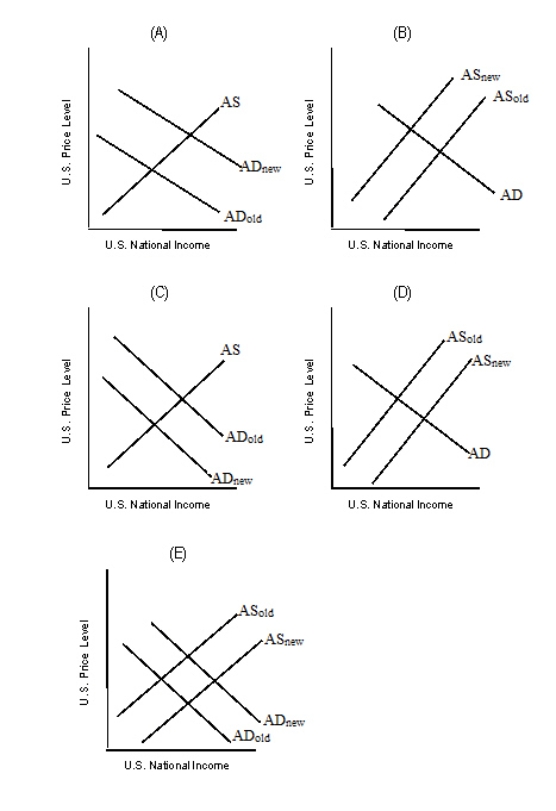 Refer to Figure 8.1.Which of the graphs in the figure best describes the impact of a generalized more optimistic view of the future by consumers?
A) Panel A
B) Panel B
C) Panel C
D) Panel D
E) Panel E
Correct Answer:
Verified
Q63: Assume that the aggregate demand increases while
Q64: Assume that the AD curve is held
Q65: Other things equal, an increase in aggregate
Q66: Identify the correct statement.
A)Aggregate demand alone determines
Q67: To determine short-run equilibrium in the economy,
Q69: Aggregate demand-aggregate supply analysis shows that in
Q70: Suppose in Country X, wages of workers
Q71: A simultaneous increase in inflation and decrease
Q72: The degree to which _ declines during
Q73: Other things equal, an increase in aggregate
Unlock this Answer For Free Now!
View this answer and more for free by performing one of the following actions

Scan the QR code to install the App and get 2 free unlocks

Unlock quizzes for free by uploading documents