The figure given below shows the consumption functions of an economy. Figure 9.4 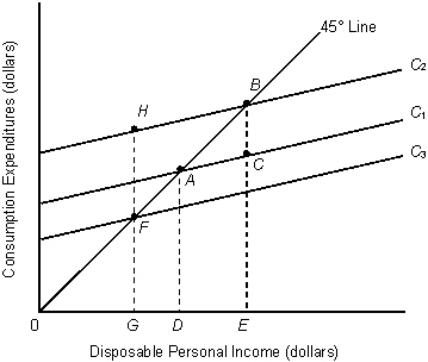 Refer to Figure 9.4.Which of the following could explain a downward shift of the consumption function from C1 to C3?
A) An increase in household wealth
B) A decrease in the proportion of young people in the population
C) An increase in the size of the population
D) A decrease in consumer confidence
E) An autonomous decrease in saving
Correct Answer:
Verified
Q43: Any increase in autonomous consumption is associated
Q44: Which of the following is true of
Q45: When the U.S.government removes investment tax credits:
A)consumption
Q46: Which of the following is a determinant
Q47: A change in consumption caused by a
Q49: Table 9.2 Q50: Which of the following statements concerning the![]()
Unlock this Answer For Free Now!
View this answer and more for free by performing one of the following actions

Scan the QR code to install the App and get 2 free unlocks

Unlock quizzes for free by uploading documents