The figure given below represents the consumption function of a country. Figure 9.3 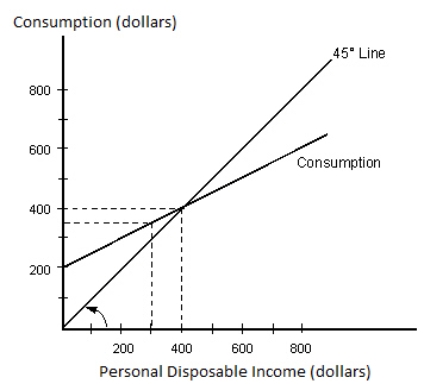 Refer to Figure 9.3.The savings function of the country will have a positive intercept at all income levels of _____.
A) less than $200
B) greater than $200
C) less than $600
D) greater than $400
E) less than $800
Correct Answer:
Verified
Q17: Identify the correct statement with respect to
Q18: The figure given below represents the saving
Q19: The part of the disposable income that
Q20: Which of the following is a stock
Q21: The consumption function becomes flatter if:
A)the average
Q23: Suppose total disposable income in Country X
Q24: If a household experiences a $880 increase
Q25: A change in the marginal propensity to
Q26: The figure given below represents the consumption
Q27: As disposable income rises:
A)consumption falls as a
Unlock this Answer For Free Now!
View this answer and more for free by performing one of the following actions

Scan the QR code to install the App and get 2 free unlocks

Unlock quizzes for free by uploading documents