The figure given below shows the consumption function of a household. Figure 9.2 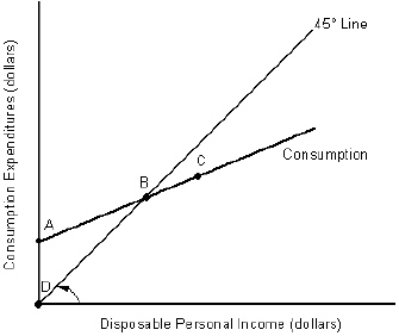 In Figure 9.2, at any point to the left of point B:
A) autonomous consumption is less than zero.
B) saving occurs.
C) disposable income is negative
D) consumption is greater than disposable income.
E) autonomous consumption is zero.
Correct Answer:
Verified
Q30: The figure given below shows the consumption
Q31: The table given below reports the consumption
Q32: The sum of the MPC and the
Q33: The table given below reports the consumption
Q34: The figure given below represents the consumption
Q36: The figure given below represents the consumption
Q37: The figure given below represents the consumption
Q38: The figure given below shows the consumption
Q39: The figure given below represents the consumption
Q40: The table given below reports the consumption
Unlock this Answer For Free Now!
View this answer and more for free by performing one of the following actions

Scan the QR code to install the App and get 2 free unlocks

Unlock quizzes for free by uploading documents