The following graph shows the demand and cost curves of an imperfectly competitive firm.MC and ATC represent the marginal cost curve and the average cost curve respectively. Figure 22.1 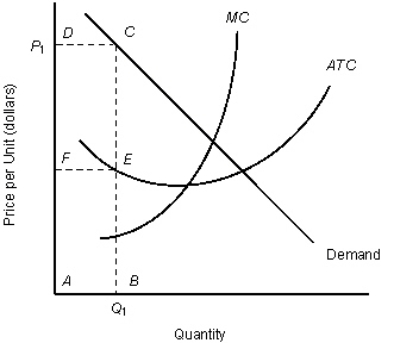 In Table 22.1, in order to maximize profits, the firm should increase output until the ____ unit of output.
A) fifth
B) sixth
C) seventh
D) eighth
E) ninth
Correct Answer:
Verified
Q21: The addition to a business firm's total
Q24: The table given below reports the marginal
Q26: The following graph shows the marginal revenue
Q26: Graphically,profit per unit of output can be
Q27: The following graph shows the marginal revenue
Q29: Suppose that Cheapo Industries,a perfectly competitive firm,currently
Q31: The following graph shows the marginal revenue
Q33: The following graph shows the demand and
Q34: Graphically,total revenue is represented by the:
A)triangle formed
Q38: A producer can raise profit by expanding
Unlock this Answer For Free Now!
View this answer and more for free by performing one of the following actions

Scan the QR code to install the App and get 2 free unlocks

Unlock quizzes for free by uploading documents