The figure given below shows the demand curves (D1 and D2) and supply curves (S1 and S2) of labor in the labor market. Figure: 29.2 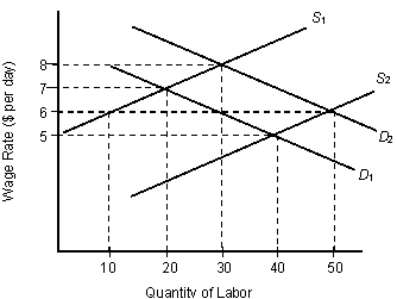 In Figure 29.2, the initial labor supply is S1 , and the labor demand is D1.If the wage is $6, which of the following is correct?
A) The actual wage is above the equilibrium wage.
B) There is a shortage of 30 workers.
C) There is a shortage of 20 workers.
D) There is a shortage of 10 workers.
E) The market is in equilibrium.
Correct Answer:

Verified
Q1: Scenario 14.1
A worker in Firm A earns
Q9: The labor demand curve is based on
Q11: It is said that a wage increase
Q12: Why does the labor market have more
Q19: The figure given below shows the demand
Q20: As the wage rate increases,the quantity supplied
Q22: The following figures show the demand and
Q23: The intention of a minimum wage is
Q36: The figures given below show the demand
Q40: Which of the following refers to human
Unlock this Answer For Free Now!
View this answer and more for free by performing one of the following actions

Scan the QR code to install the App and get 2 free unlocks

Unlock quizzes for free by uploading documents