The figure given below depicts the demand and supply of Brazilian reals in the foreign exchange market.Assume that the market operates under a flexible exchange rate regime. Figure 36.1 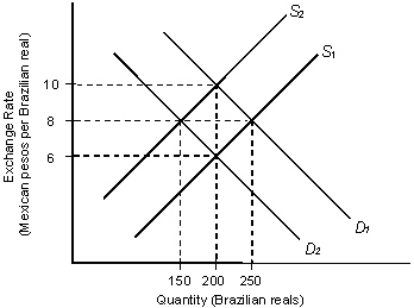 In the figure:
D1 and D2: Demand for Brazilian reals
S1 and S2: Supply of Brazilian reals
Refer to Figure 36.1.If the initial equilibrium exchange rate is 6 pesos per real, then other things equal, a decrease in the number of Brazilian tourists to Mexico would:
A) increase the demand for Brazilian reals from D2 to D1 and increase the exchange rate to 8 pesos per real.
B) decrease the supply of Brazilian reals from S1 to S2 and increase the exchange rate to 8 pesos per real.
C) decrease the supply of Brazilian reals from S1 to S2 and increase the exchange rate to 10 pesos per real.
D) decrease the demand for Brazilian reals from D1 to D2 and increase the exchange rate to 8 pesos per real.
E) decrease the supply of Brazilian reals from S1 to S2 and increase the demand for Brazilian reals from D2 to D1, thereby changing the exchanging rate to 10 pesos per real.
Correct Answer:
Verified
Q43: In 1991,the French mineral water Perrier was
Q47: The supply of Thai baht in the
Q53: The figure given below depicts the foreign
Q54: The figure given below depicts the foreign
Q58: The figure given below depicts the demand
Q59: Under the flexible exchange rate system,when a
Q59: The figure given below depicts the demand
Q60: The figure given below depicts the demand
Q73: The figure given below depicts the foreign
Q75: Deviations from purchasing power parity will be
Unlock this Answer For Free Now!
View this answer and more for free by performing one of the following actions

Scan the QR code to install the App and get 2 free unlocks

Unlock quizzes for free by uploading documents