The figure given below depicts the demand and supply of Brazilian reals in the foreign exchange market.Assume that the market operates under a flexible exchange rate regime. Figure 36.1 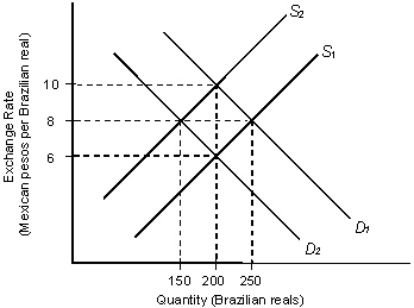 In the figure:
D1 and D2: Demand for Brazilian reals
S1 and S2: Supply of Brazilian reals
Refer to Figure 36.1.Suppose the initial equilibrium exchange rate is 10 pesos per real.A decrease in the Mexican demand for Brazilian coffee, other things equal, is most likely to result in a new equilibrium exchange rate of:
A) 6 pesos per real and an equilibrium quantity of 200 Brazilian reals.
B) 6 pesos per real and an equilibrium quantity of 250 Brazilian reals.
C) 8 pesos per real and an equilibrium quantity of 150 Brazilian reals.
D) 8 pesos per real and an equilibrium quantity of 100 Brazilian reals.
E) 10 pesos per real and an equilibrium quantity of 200 Brazilian reals.
Correct Answer:
Verified
Q23: The figure below shows the demand (D)
Q26: Foreign exchange market intervention is most effective
Q28: The figure below shows the demand (D)
Q33: The figure below shows the demand (D)
Q37: The figure below shows the demand (D)
Q38: The figure below shows the demand (D)
Q43: The figure given below depicts the demand
Q44: The figure given below depicts the foreign
Q47: The figure given below depicts the demand
Q51: The figure given below depicts the foreign
Unlock this Answer For Free Now!
View this answer and more for free by performing one of the following actions

Scan the QR code to install the App and get 2 free unlocks

Unlock quizzes for free by uploading documents