The figure given below depicts the demand and supply of Brazilian reals in the foreign exchange market.Assume that the market operates under a flexible exchange rate regime. Figure 36.1 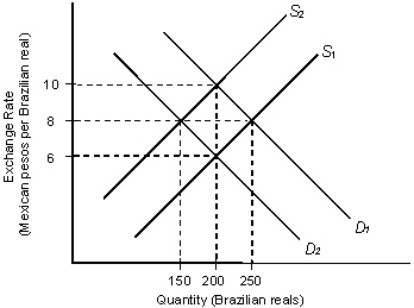 In the figure:
D1 and D2: Demand for Brazilian reals
S1 and S2: Supply of Brazilian reals
Refer to Figure 36.1.Assume that the initial equilibrium exchange rate is 8 Mexican pesos per Brazilian real and 150 brazilian reals are traded in the market.Suppose, there is an increase in the Brazilian demand for Mexican exports.Other things remaining equal, which of the following can be concluded?
A) The demand curve for Brazilian reals will shift to the the right.
B) The supply curve of Brazilian reals will shift to the the right.
C) The Mexican pesos will depreciate in value.
D) The Brazilian reals will appreciate in value.
E) Around 100 Brazilian reals will be traded in the forex market.
Correct Answer:
Verified
Q23: The figure below shows the demand (D)
Q25: The figure below shows the demand (D)
Q26: Foreign exchange market intervention is most effective
Q27: The figure below shows the demand (D)
Q28: The figure below shows the demand (D)
Q30: The figure below shows the demand (D)
Q32: The figure below shows the demand (D)
Q36: The figure below shows the demand (D)
Q38: The figure below shows the demand (D)
Q39: The figure below shows the demand (D)
Unlock this Answer For Free Now!
View this answer and more for free by performing one of the following actions

Scan the QR code to install the App and get 2 free unlocks

Unlock quizzes for free by uploading documents