A student was interested in the cigarette smoking habits of college students and collected data from an unbiased random sample of students. The data is summarized in the following table: 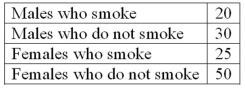 What type of chart best represents relative class frequencies?
A) Box plot
B) Pie chart
C) Scatter plot
D) Frequency polygon
Correct Answer:
Verified
Q31: For a relative frequency distribution, relative frequency
Q32: What is the following table called?
Q33: Refer to the following distribution of commissions:
Q35: Why are unequal class intervals sometimes used
Q36: A student was studying the political party
Q37: A student was interested in the cigarette
Q39: When a class interval is expressed as
Q40: A student was studying the political party
Q40: The number of employees less than the
Q41: Refer to the following breakdown of responses
Unlock this Answer For Free Now!
View this answer and more for free by performing one of the following actions

Scan the QR code to install the App and get 2 free unlocks

Unlock quizzes for free by uploading documents