Multiple Choice
The following graph is a 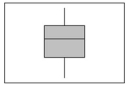
A) Dot plot
B) Stem-and-leaf display
C) Box plot
D) Contingency table
Correct Answer:
Verified
Related Questions
Q6: A dot plot is useful for quickly
Q11: A relationship between two nominal variables is
Q11: A box plot graphically shows the 10th
Q18: A dot plot is an easy way
Q26: A dot plot shows _.
A) The general
Q28: A box plot shows _.
A) The mean
Q29: What statistics are needed to draw a
Q39: Quartiles divide a distribution into _.
A)2 equal
Q45: Outliers are clearly presented in a _.
A)
Q49: If the coefficient of skewness is equal
Unlock this Answer For Free Now!
View this answer and more for free by performing one of the following actions

Scan the QR code to install the App and get 2 free unlocks

Unlock quizzes for free by uploading documents