A random sample of 40 companies with assets over $10 million was surveyed and asked to indicate their industry and annual computer technology expense. The ANOVA comparing the average computer technology expense among three industries rejected the null hypothesis. The Mean Square Error (MSE) was 195. The following table summarized the results: 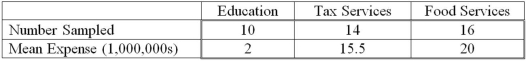 When comparing the mean annual computer technology expense for companies in the education and tax services industries, the following 95% confidence interval can be constructed: _______________.
A) 13.5 ± 2.026 * 5.78
B) 13.5 ± 2.021 * 5.78
C) 13.5 ± 2.026 * 13.96
D) 13.5 ± 2.021 * 13.96
Correct Answer:
Verified
Q52: Two accounting professors decided to compare the
Q53: The annual dividend rates for a random
Q54: A random sample of 40 companies with
Q55: The annual dividend rates for a random
Q56: Two accounting professors decided to compare the
Q58: The annual dividend rates for a random
Q59: A random sample of 30 executives from
Q82: The F distribution is a _ distribution.
Q83: In a one-way ANOVA, _ degrees of
Q88: In a one-way ANOVA, the degrees of
Unlock this Answer For Free Now!
View this answer and more for free by performing one of the following actions

Scan the QR code to install the App and get 2 free unlocks

Unlock quizzes for free by uploading documents