Exhibit 12.1
The following questions use the information below.
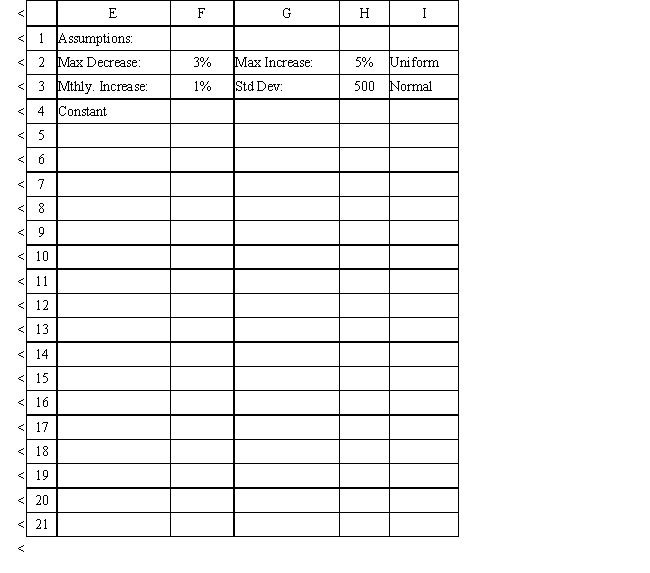
The owner of Fix-a-dent Auto Repair wants to study the growth of his business using simulation. He is interested in simulating the number of damaged cars and the amount of damage to the cars each month. He currently repairs 100 cars per month and feels this can vary uniformly between a decrease of as much as 3% and an increase of up to 5% (average change of 1%) over the previous months. The dollar value of the damage to the cars is a normally distributed random variable with a mean of $3,000 and a standard deviation of $500. The average repair bill has been increasing steadily over the years and the owner expects the mean repair bill will increase by 1% per month. You have created the following spreadsheet to simulate the problem. 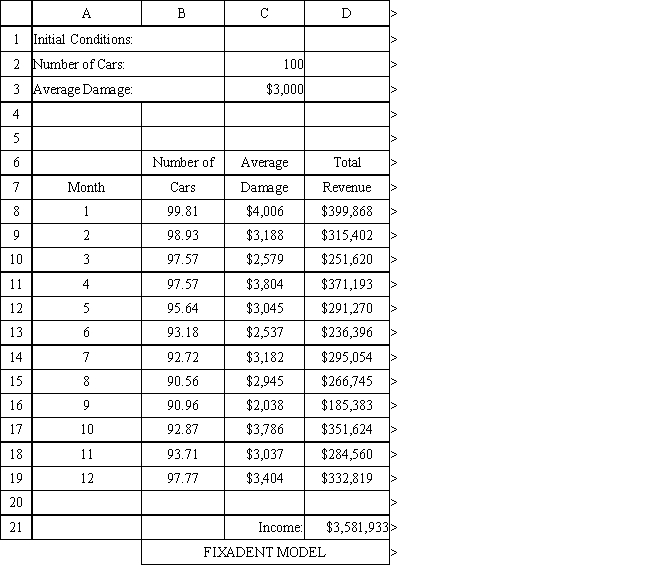
-Using the information in Exhibit 12.1, what formula should go cell G5 to calculate the 80th percentile of the empirical distribution of income?
A) =IF(RANK(D21) = 80, 1, 0)
B) None, use Excel Histogram on cell D21.
C) =IF(COUNTIF(D8:D19 > D21) ≥ 8, 1, 0)
D) =PsiPercentile(B21, .8) .
Correct Answer:
Verified
Q18: Simulation is used to
A) find possible worst
Q19: Exhibit 12.4.
The following questions use the information
Q20: Several techniques are available to help managers
Q21: Methods for analyzing risk that are discussed
Q22: Uncertainty
A) is the most difficult thing about
Q24: Which Analytic Solver Platform function will generate
Q25: Which of the following probability distributions are
Q26: Exhibit 12.3
The following questions use the information
Q27: Best case analysis is a(n) _ view
Q28: Which of the following distributions can be
Unlock this Answer For Free Now!
View this answer and more for free by performing one of the following actions

Scan the QR code to install the App and get 2 free unlocks

Unlock quizzes for free by uploading documents