Exhibit 10.6
The information below is used for the following questions.
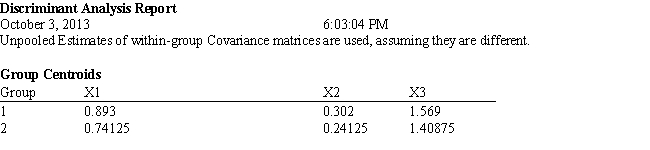
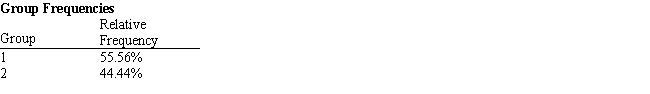
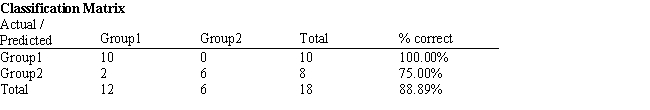
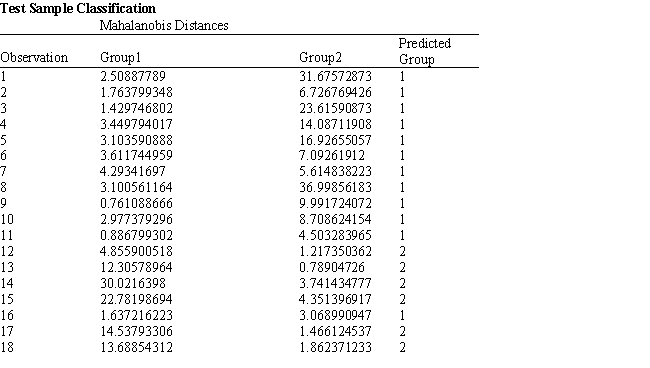
An investor wants to classify companies as being either a good investment, Group 1, or a poor investment, Group 2. He has gathered Liquidity, Profitability and Activity data on 18 companies he has invested in and run a regression analysis. Discriminant Analysis output has also been generated. The data for the problem and the relevant output are shown below. 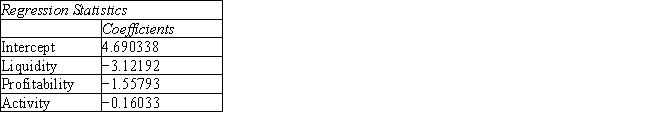
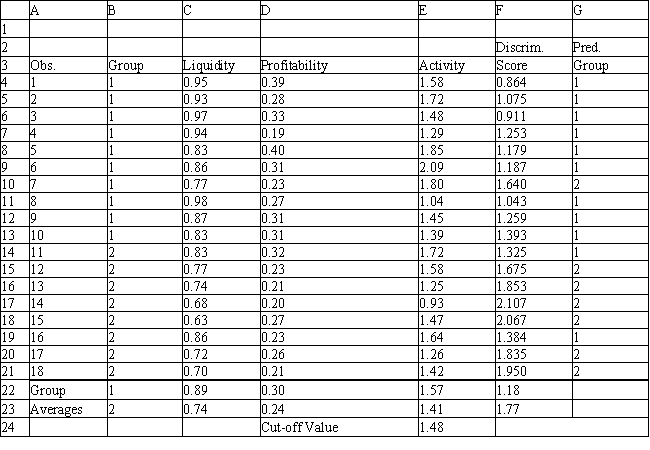
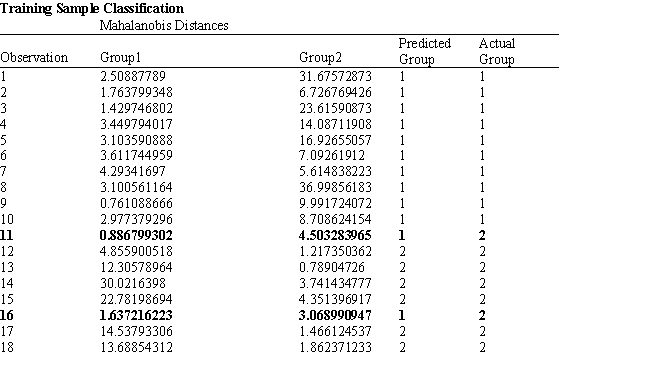
-Refer to Exhibit 10.6. Compute the discriminant score and predicted group for a company with Liquidity = 0.91, Profitability = 0.32 and Activity = 1.39.
Correct Answer:
Verified
View Answer
Unlock this answer now
Get Access to more Verified Answers free of charge
Q106: Exhibit 10.1
The following questions are based on
Q107: Exhibit 10.1
The following questions are based on
Q108: Oversampling forces a classification method to
A) discriminate
Q109: In classification techniques the dependent variable is
A)
Q110: A test sample is often used to
Q112: The regression approach can be used in
Q113: Suppose the Fisher classification scores for an
Q114: Exhibit 10.2
The following questions are based on
Q115: The concept behind neural networks is to
A)
Q116: Exhibit 10.6
The information below is used for
Unlock this Answer For Free Now!
View this answer and more for free by performing one of the following actions

Scan the QR code to install the App and get 2 free unlocks

Unlock quizzes for free by uploading documents