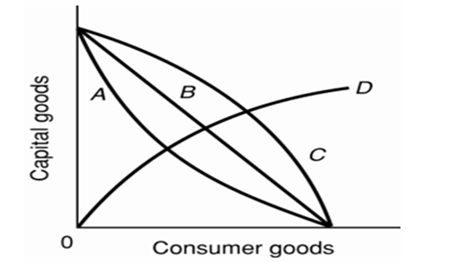
-Refer to the above diagram.Curve B is a:
A) production possibilities curve indicating constant opportunity costs.
B) production possibilities curve indicating increasing opportunity costs.
C) demand curve indicating that the quantity of consumer goods demanded increases as the price of capital falls.
D) technology frontier curve.
Correct Answer:
Verified
Q125: Q127: Q130: Q141: A typical concave production possibilities curve implies: Q146: If the production possibilities curve were a Q150: A nation's production possibilities curve is "bowed Q151: If the production possibilities curve is a Q152: The law of increasing opportunity costs is Q160: The law of increasing opportunity costs exists Q179: The marginal benefit curve is: Unlock this Answer For Free Now! View this answer and more for free by performing one of the following actions Scan the QR code to install the App and get 2 free unlocks Unlock quizzes for free by uploading documents![]()
![]()
![]()
A)that
A)upward sloping because

