Below is a histogram of car prices on a used-car lot. An advertisement for the lot says the average price of a car for sale is $12,000. Could the advertisement be true? Why or why not? 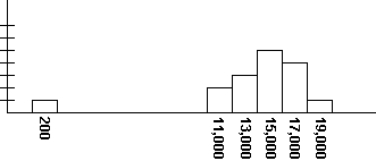
Correct Answer:
Verified
Q1: Two towns both have a mean income
Q3: Below is a histogram for a set
Q4: After computing the standard deviation for a
Q5: Refer to this stemplot to answer
Q6: The data below represent the numbers of
Q7: In the list of five measurements
Q8: Refer to this stemplot to answer
Q9: Refer to this stemplot to answer
Q10: Below are the ages of students attending
Q11: In a normal distribution with mean 100
Unlock this Answer For Free Now!
View this answer and more for free by performing one of the following actions

Scan the QR code to install the App and get 2 free unlocks

Unlock quizzes for free by uploading documents