A local fundraiser wants to graphically display the contributions he has received over the past five years. Construct a time series graph for the following data. 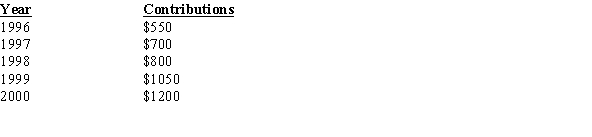
Correct Answer:
Verified
Q50: How many values are in the data
Q51: The following information shows the colors of
Q53: Karen is constructing a pie graph to
Q54: Which graph should be used to represent
Q56: Construct a pie graph using the following
Q57: Given the following frequency distribution, how many
Q58: Construct a pie chart for the following
Q59: A weatherman records the amount of rain
Q96: A time series graph represents data that
Q98: A pie graph would best represent the
Unlock this Answer For Free Now!
View this answer and more for free by performing one of the following actions

Scan the QR code to install the App and get 2 free unlocks

Unlock quizzes for free by uploading documents