A recent statistics exam yielded the following 10 scores. Construct a frequency polygon distribution using the class limits shown below.
80, 99, 77, 67, 93, 70, 76, 86, 79, 71 
A) 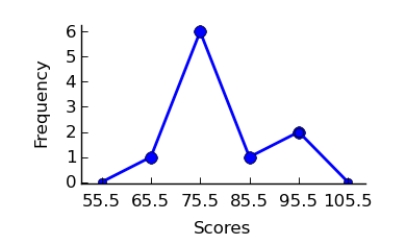
B) 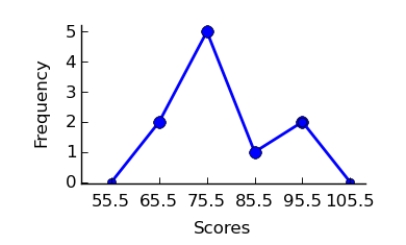
C) 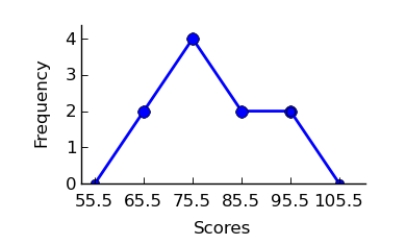
D) 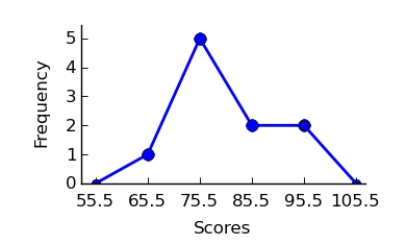
Correct Answer:
Verified
Q28: The cumulative frequency for a class is
Q35: Which of the following is a histogram?
A)
Q37: Using the ogive shown below, what is
Q41: Construct a Pareto chart for the following
Q43: A pie graph is not useful in
Q44: Construct a Pareto chart for the following
Q48: The frequency polygon is a graph that
Q54: A histogram is a graph that represents
Q60: If the graph of a frequency distribution
Q97: A time series graph is useful for
Unlock this Answer For Free Now!
View this answer and more for free by performing one of the following actions

Scan the QR code to install the App and get 2 free unlocks

Unlock quizzes for free by uploading documents