Which plot below has a five-number summary of 5, 7, 8, 12, 13 and an interquartile range of 5?
A) 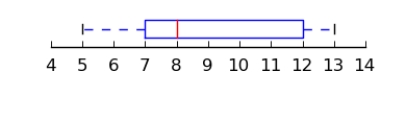
B) 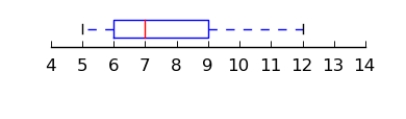
C) 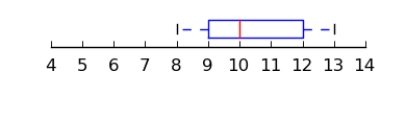
D) 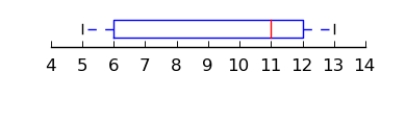
Correct Answer:
Verified
Q57: Given that the mean of a set
Q58: For a set of data with a
Q59: If a set of data has 81
Q60: The average resident of Metro City produces
Q61: Given the following boxplot where m is
Q63: Check the following data set for outliers.
43,
Q64: The data shown represents the high scores
Q65: Using the table below, what grade would
Q66: The average weekly earnings in dollars for
Q67: The average weight of adult male bison
Unlock this Answer For Free Now!
View this answer and more for free by performing one of the following actions

Scan the QR code to install the App and get 2 free unlocks

Unlock quizzes for free by uploading documents