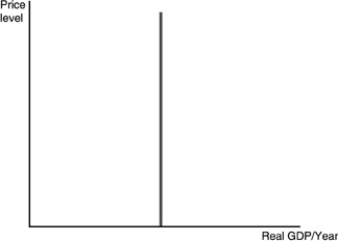
-The curve in the above figure will shift to the right when
A) the price level falls.
B) technology increases.
C) population falls.
D) the proportion of the population that is elderly increases.
Correct Answer:
Verified
Q41: The level of real GDP identified by
Q43: The aggregate supply curve cannot tell us
A)
Q48: Real GDP will increase over the long
Q49: Q52: The natural rate of unemployment will help Q53: We draw the long-run aggregate supply curve Q57: The long-run aggregate supply curve will shift Q58: The long-run aggregate supply curve will shift Q59: The aggregate supply curve shows Q77: Economic growth causes the![]()
A)the total of
A) production possibilities curve
Unlock this Answer For Free Now!
View this answer and more for free by performing one of the following actions

Scan the QR code to install the App and get 2 free unlocks

Unlock quizzes for free by uploading documents