Suppose that a communicable disease has an infection stage and an incubation stage (like HIV and AIDS). Assume that the infection rate is a constant  people per month and the incubation distribution is
 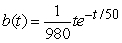 month-1. The rate at which people develop the disease at time
  is given by
 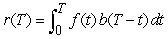 people per month. Use your CAS to find expressions for both the rate
  and the number of people
 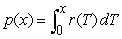 who develop the disease between times
  and
and  . Explain why the graph
  has a horizontal asymptote. For small
  's, the graph of
  is concave up; explain what happens for large
  's.
's.
Correct Answer:
Verified
The graph
View Answer
Unlock this answer now
Get Access to more Verified Answers free of charge
Q98: Find the area between Q99: Find an equation of the tangent line Q100: Find the average value of the function Q101: Make the indicated substitution for an unspecified Q102: Estimate the integral numerically. Q104: Evaluate the integral. Q105: Use the given substitution to evaluate the Q106: Evaluate the integral. Q107: Evaluate the definite integral. Q108: Evaluate the integral. Unlock this Answer For Free Now! View this answer and more for free by performing one of the following actions Scan the QR code to install the App and get 2 free unlocks Unlock quizzes for free by uploading documents![]()
![]()
![]()
![]()
![]()
![]()

