Which graph best describes how the vapor pressure of a solution varies according to Raoult's law as a nonvolatile solute is added to a liquid? The vapor pressure of the solution is plotted on the y-axis, and the mole fraction of solute is plotted on the x-axis. The origin (0, 0) is not necessarily located where the axes cross. 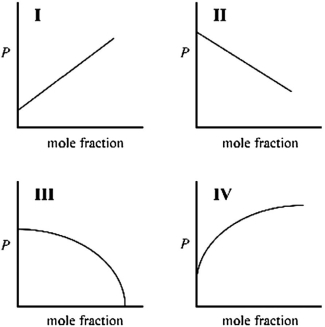
A) I
B) II
C) III
D) IV
Correct Answer:
Verified
Q37: Which of the following compounds has the
Q38: In the following Born-Haber cycle for the
Q39: In the following Born-Haber cycle for the
Q40: Calculate the lattice energy of sodium fluoride
Q41: Which of the solutions shown here will
Q43: In the diagram below, one beaker contains
Q44: Which statement about the vapor pressure of
Q45: Indicate which aqueous solution has the highest
Q46: A solution is prepared by adding
Q47: Which of the solutions shown here will
Unlock this Answer For Free Now!
View this answer and more for free by performing one of the following actions

Scan the QR code to install the App and get 2 free unlocks

Unlock quizzes for free by uploading documents