Which graph best describes how the vapor pressure of a substance varies with temperature according to the Clausius-Clapeyron equation? ln(P) is plotted on the y-axis, and 1/T is plotted on the x-axis. The origin (0, 0) is not necessarily located where the axes cross. 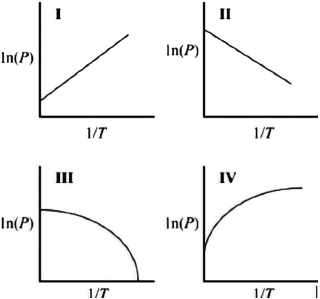
A) I
B) II
C) III
D) IV
Correct Answer:
Verified
Q48: Indicate which aqueous solution has the lowest
Q49: Which statement about the vapor pressure of
Q50: Which statement below regarding vapor pressure is
Q51: Which of the following is needed to
Q52: Indicate which aqueous solution has the lowest
Q54: Which intermolecular interactions are likely to result
Q55: A solution contains 6.50 mol water,
Q56: Which statement about how the vapor
Q57: Which intermolecular interactions are likely to result
Q58: A solution is prepared by adding
Unlock this Answer For Free Now!
View this answer and more for free by performing one of the following actions

Scan the QR code to install the App and get 2 free unlocks

Unlock quizzes for free by uploading documents