 Figure 23.3
-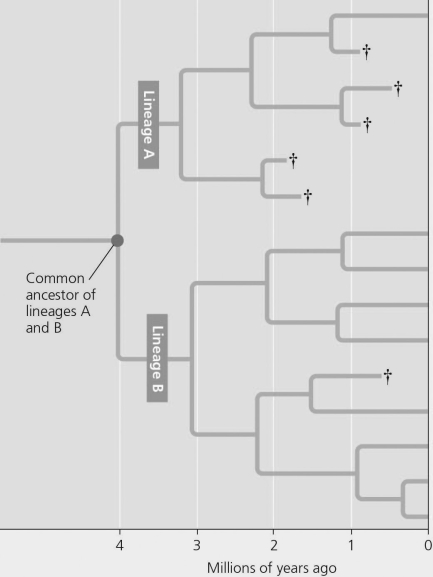 Figure 23.4
This evolutionary tree shows the influence of speciation and extinction on the diversity of life. After 2 million years lineage A had a(n) ________ rate of speciation and ________ extinction rates compared to lineage B.
A) higher; lower
B) lower; higher
C) increased; decreased
D) improved; enhanced
Correct Answer:
Verified
Q5: The evolution of mammals from early tetrapods
A)is
Q16: Hox genes are a group of related
Q18: The first terrestrial organisms probably were considered
Q19: For purposes of differentiation, what is the
Q22: The existence of evolutionary trends, such as
Q24: Bagworm moth caterpillars feed on evergreens and
Q26: Please use the following information to answer
Q41: Please use the following information to answer
Q51: Q57: ![]()
![]()
Unlock this Answer For Free Now!
View this answer and more for free by performing one of the following actions

Scan the QR code to install the App and get 2 free unlocks

Unlock quizzes for free by uploading documents