Which of the following graphs illustrates the growth curve of a small population of rodents that has grown to reach a static carrying capacity?
A) 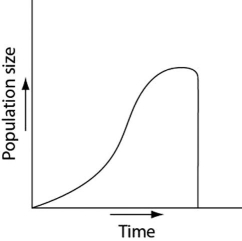
B) 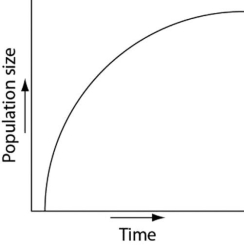
C) 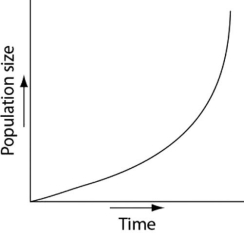
D) 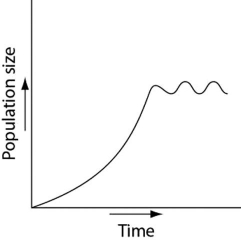
E) 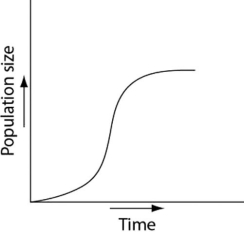
Correct Answer:
Verified
Q42: Which statement best explains survivorship curve B?
A)
Q50: Use the survivorship curves in Figure 53.1
Q85: Please use the following information to answer
Q86: Please use the following information to answer
Q86: According to the logistic growth equation
[&*frac*{dN}{dt}|=|rN|thn|*frac*{(K|-|N)}{K}&]
A)the number
Q87: Q88: Which of the following graphs illustrates the Q90: Which of the following biomes is correctly![]()
Unlock this Answer For Free Now!
View this answer and more for free by performing one of the following actions

Scan the QR code to install the App and get 2 free unlocks

Unlock quizzes for free by uploading documents