Multiple Choice
Which of the following graphs illustrates the growth curve of a small population of rodents that has grown to reach a static carrying capacity?
A) 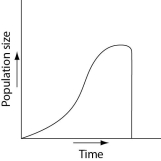
B) 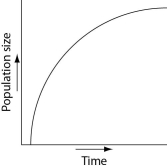
C) 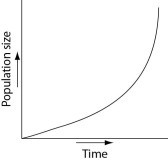
D) 
E) 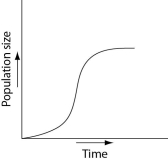
Correct Answer:
Verified
Related Questions
Q42: Which statement best explains survivorship curve B?
A)
Q64: Imagine that you are managing a large
Q69: Which of the following biomes is correctly
Q73: If the direction of Earth's rotation reversed,
Q76: A population's carrying capacity
A) may change as
Q82: When climbing a mountain, we can observe
Q83: Use this description to answer the following
Unlock this Answer For Free Now!
View this answer and more for free by performing one of the following actions

Scan the QR code to install the App and get 2 free unlocks

Unlock quizzes for free by uploading documents