The data in this graph indicate 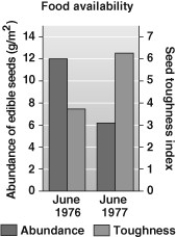
A) there were fewer total tough seeds in 1976 than in 1977.
B) plants that produced soft seeds in 1976 produced tougher seeds in 1977.
C) available seeds were generally tougher in 1977 than in 1976.
D) seed abundance in 1977 was severely reduced by finch feeding.
Correct Answer:
Verified
Q39: Two bird species overlap in a hybrid
Q40: Which of the following would tend to
Q41: In the North Pacific Ocean, two groups
Q42: In the North Pacific Ocean, two groups
Q43: If the divergence illustrated here is based
Q45: Which of these is the best hypothesis
Q46: The Grants' work on natural selection would
Q47: For speciation to occur there must be
A)
Q48: The Grants' finch research included morphological, geographic,
Q49: Which butterfly has changed gradually but significantly
Unlock this Answer For Free Now!
View this answer and more for free by performing one of the following actions

Scan the QR code to install the App and get 2 free unlocks

Unlock quizzes for free by uploading documents