Which of these can be concluded from the figure below? 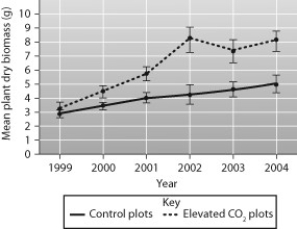
A) In some years of the study the mean poison ivy biomass decreased to the level it was at the beginning of the study.
B) There were more elevated CO2 plots than control plots.
C) Not all of the increase in mean poison ivy biomass can be attributed to the CO2 that the researcher added.
D) Poison ivy in the experimental plots was more toxic than that in the control plots.
Correct Answer:
Verified
Q66: It has been suggested that scientists should
Q67: Put the following steps of the light
Q68: You want to use radioactively labeled oxygen
Q69: Many of the regions of the world
Q70: What likely caused the slight increase of
Q72: Red algae are found in relatively deep
Q73: Chlorophyll is located in _, which are
Q74: In this drawing of a chloroplast, which
Q75: Atrazine is a widely used herbicide that
Q76: According to this figure, how do hydrogen
Unlock this Answer For Free Now!
View this answer and more for free by performing one of the following actions

Scan the QR code to install the App and get 2 free unlocks

Unlock quizzes for free by uploading documents