Use the graphs of f and g given below to estimate the values of f(g(x)) for x = , , , 0, 1, 2, and 3, and use these values to sketch a graph of y = f(g(x)). 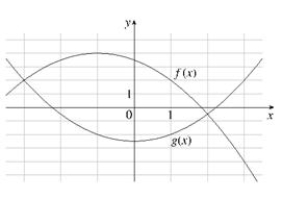
Correct Answer:
Verified
Q91: Let f (x) =
Q92: The following time-of-day and temperature (F
Q93: Classify the function f(x) = sin
Q94: Relative to the graph of y
Q95: Given the graph of y =
Q97: The following table contains United States
Q98: Evaluate the difference quotient
Q99: Classify the function f(x) =
Q100: Classify the function f(x) =
Q101: Let f (x) =
Unlock this Answer For Free Now!
View this answer and more for free by performing one of the following actions

Scan the QR code to install the App and get 2 free unlocks

Unlock quizzes for free by uploading documents