Given the graph below, use 5 rectangles to estimate the area under the graph from x = 0 to x = 5. Compute L5 (sample points are left endpoints), R5 (sample points are right endpoints) and M5 (sample points are midpoints). Which of the estimates appears to give the best estimate? Justify your answer. 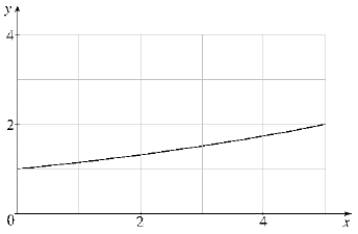
Correct Answer:
Verified
View Answer
Unlock this answer now
Get Access to more Verified Answers free of charge
Q229: Given the graph below, use 3 rectangles
Q230: The velocity v (in cm/s) of
Q231: Given the graph below, use 5 rectangles
Q232: Sketch a plane region whose area
Q233: Sketch a plane region whose area
Q234: Use right endpoints with n =
Q235: Use Definition 2 to show that
Q237: Sketch a plane region whose area
Q238: Use Definition 2 to show that
Q239: Given the graph below, use 5 rectangles
Unlock this Answer For Free Now!
View this answer and more for free by performing one of the following actions

Scan the QR code to install the App and get 2 free unlocks

Unlock quizzes for free by uploading documents