Which of the following statements describe(s) the line chart below? 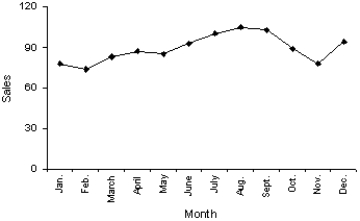
A) November experienced the lowest sales throughout the year.
B) August experienced the highest sales throughout the year.
C) Sales did not fluctuate more than 30 units on either side of 90.
D) All of these choices are true.
Correct Answer:
Verified
Q27: The Chief of Police conducted a survey
Q37: The final grade received in a Literature
Q40: What values are displayed on a cumulative
Q61: Observations that are measured at the same
Q76: Which of the following statements describes a
Q77: Time-series data are often graphically depicted how?
A)Bar
Q79: What kind(s)of data can be depicted by
Q80: Which of the following represents time-series data?
A)The
Q95: The relationship between two interval variables is
Q97: Which of the following describes a positive
Unlock this Answer For Free Now!
View this answer and more for free by performing one of the following actions

Scan the QR code to install the App and get 2 free unlocks

Unlock quizzes for free by uploading documents