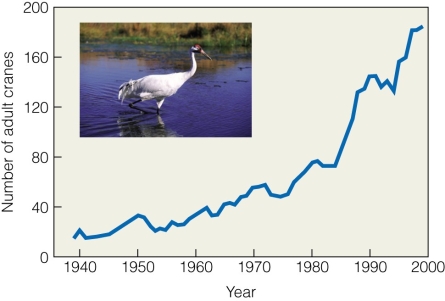
 The pattern shown in figure 9.6 best resembles
A) a survivorship curve.
B) exponential growth.
C) R0= 0.
D) r < 0.
Correct Answer:
Verified
Q6: The _ birthrate is expressed as the
Q7: A population eventually becomes _ when its
Q8: A population that is increasing in size
Q9: _ is the study of populations.
Q10: A(n)_ curve plots the probability at birth
Q12: Movement in and out of a population
Q13: _ stochasticity is the random variation in
Q14: When the conditions are favorable for a
Q15: Populations inhabiting favorable environments at low population
Q16: A(n)_ distribution refers to the proportion of
Unlock this Answer For Free Now!
View this answer and more for free by performing one of the following actions

Scan the QR code to install the App and get 2 free unlocks

Unlock quizzes for free by uploading documents