Productivity and yield of cultivated crops are often reduced by insect pests. The following graph shows the relationship between the yield of a certain crop,  , as a function of the density of aphids x. (Aphids are small insects that suck plant juices.) Here,
  is measured in kilograms/ 4,000 square meters, and x is measured in hundreds of aphids/bean stem. By computing the slopes of the respective tangent lines, estimate the rate of change of the crop yield with respect to the density of aphids when that density is 200 aphids/bean stem and when it is 800 aphids/bean stem.
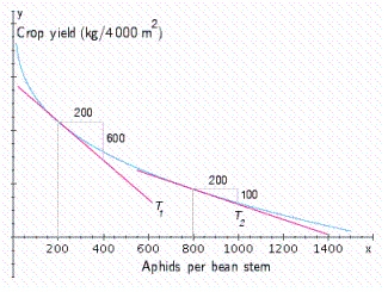
Correct Answer:
Verified
Q19: The following graph shows the volume of
Q20: During the construction of a high-rise building,
Q21: Find the indicated one-sided limit. 
Q22: Find the values of x for which
Q23: During the construction of a high-rise building,
Q25: Let Q26: Use the four-step process to find the Q27: Under a set of controlled laboratory conditions, Q28: Find the indicated one-sided limit. Q29: Let ![]()
![]()
Unlock this Answer For Free Now!
View this answer and more for free by performing one of the following actions

Scan the QR code to install the App and get 2 free unlocks

Unlock quizzes for free by uploading documents