In the following figure,  gives the population
  of a certain bacteria culture at time t after a portion of bactericide A was introduced into the population at
  . The graph of g gives the population
  of a similar bacteria culture at time t after a portion of bactericide B was introduced into the population at
  .
. 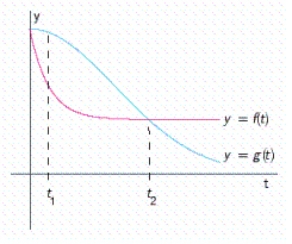 Which population is decreasing faster at
  and at
  ?
?
A) The populations are decreasing at the same rate at  ,
, is decreasing faster at
B)  is decreasing faster at
 ,
, is decreasing faster at
C)  is decreasing faster at
 , the populations are decreasing at the same rate at
D)  is decreasing faster at
 ,
, is decreasing faster at
Correct Answer:
Verified
Q1: Use the four-step process to find the
Q2: The position of car A and car
Q3: Find the slope of the tangent line
Q5: Use the four-step process to find the
Q6: Under a set of controlled laboratory conditions,
Unlock this Answer For Free Now!
View this answer and more for free by performing one of the following actions

Scan the QR code to install the App and get 2 free unlocks

Unlock quizzes for free by uploading documents