The graph below gives distance in miles from a starting point as a function of time in hours for a car on a trip. Find the fastest speed (magnitude of velocity) during the trip. Describe how the speed during the first 2 hours compares to the speed during the last 2 hours. Describe what is happening between 2 and 3 hours. 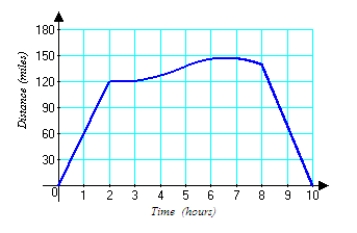
Correct Answer:
Verified
Q1: Find the average velocity for an object
Q2: Below is a graph of 
Q4: Find the equation of the tangent line
Q5: Estimate the slope of the tangent line
Q6: Compute the slope of the secant line
Q7: Find an equation of the tangent line
Q8: Compute the derivative function f '(x) of
Q9: Compute the derivative function f '(x) of
Q10: Compute the slopes of the secant lines
Q11: Find the equation of the tangent line
Unlock this Answer For Free Now!
View this answer and more for free by performing one of the following actions

Scan the QR code to install the App and get 2 free unlocks

Unlock quizzes for free by uploading documents