A graph of a model for the sales of services between 2004 and 2008 by Kelly Services, Inc., a leading global provider of staffing services, is shown below. 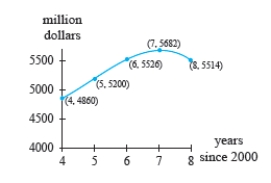 Calculate the percentage change in Kelly's sales between 2004 and 2007.
A) $822 million
B) $4860 million
C) $411 million
D) $10542 million
E) $5271 million
Correct Answer:
Verified
Q9: The function D gives the time, in
Q10: The function g gives the fuel efficiency,
Q11: Calculate the average rate of change of
Q12: The function P gives the profit in
Q13: A graph of a model for the
Q15: The population in a certain country was
Q16: The function f gives the weekly profit,
Q17: Use the figure to answer the questions.
Q18: An Airline industry posted a profit of
Q19: Identify which points have lines drawn through
Unlock this Answer For Free Now!
View this answer and more for free by performing one of the following actions

Scan the QR code to install the App and get 2 free unlocks

Unlock quizzes for free by uploading documents