A graph of a model for the sales of services between 2004 and 2008 by Kelly Services, Inc., a leading global provider of staffing services, is shown below. 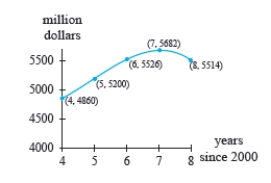 Use the graph to calculate the average rate of change in Kelly's sales of services between 2005 and 2007.
A) 241 million dollars per year
B) 274 million dollars per year
C) 5500 million dollars per year
D) 550 million dollars per year
E) 5 million dollars per year
Correct Answer:
Verified
Q1: Calculate the average rate of change in
Q2: The percentage of students meeting national mathematics
Q4: Given the statement: In five trading days,
Q5: The function p gives the number of
Q6: The function B gives the balance, in
Q7: The function w gives the number of
Q8: The function D gives the time, in
Q9: The function D gives the time, in
Q10: The function g gives the fuel efficiency,
Q11: Calculate the average rate of change of
Unlock this Answer For Free Now!
View this answer and more for free by performing one of the following actions

Scan the QR code to install the App and get 2 free unlocks

Unlock quizzes for free by uploading documents