Multiple Choice
The table shows per capita peach consumption. Find a cross-sectional model for a yearly income of $40,000. 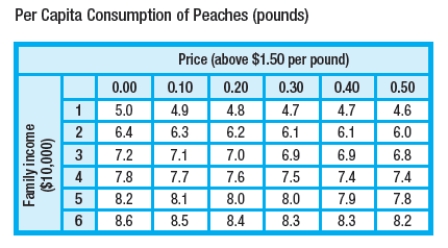
A)  pounds
B)  pounds
C)  pounds
D)  pounds
E)  pounds
Correct Answer:
Verified
Related Questions
Q17: Let Q18: The figures show the profit (in hundred Q19: A process to extract pectin and pigment Q20: Consider the table of apparent temperatures (given Q21: If Q23: Two vending machines sit side by side Q24: The table shows per capita peach consumption. Unlock this Answer For Free Now! View this answer and more for free by performing one of the following actions Scan the QR code to install the App and get 2 free unlocks Unlock quizzes for free by uploading documents![]()
![]()

