The figures show a contour graph for a function f in blue with a constraint function  in black. Locate any optimal points of
  and classify each as a relative maximum point or a relative minimum point.
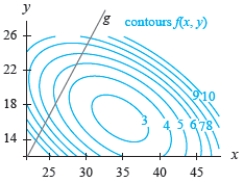
A) (31, 10, 4)
B) (32, 14, 2)
C) (35, 16, 2)
D) (32, 16, 2)
E) (35, 18, 2)
Correct Answer:
Verified
Q25: The daily output at a plant manufacturing
Q26: Let Q27: Let Q28: A travel agency offers spring-break cruise packages. Q29: Identify the optimal point as either a Q31: Express SSE as a multivariable function of Q32: A company has the Cobb-Douglas production function Q33: For a region, the percentage of adults Q34: A model for the elevation above sea Q35: Express SSE as a multivariable function of![]()
![]()
Unlock this Answer For Free Now!
View this answer and more for free by performing one of the following actions

Scan the QR code to install the App and get 2 free unlocks

Unlock quizzes for free by uploading documents