Data were collected for a sample of companies regarding their investment in quality improvement efforts and cost savings realized as a result (both measured as a percentage of sales revenue). Below is the scatterplot. 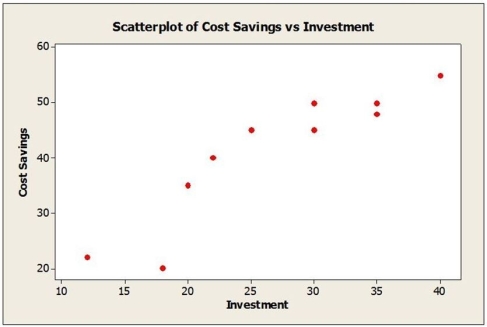 The correlation coefficient for these data is r = 0.913. If data were collected for individual departments within companies rather than at the company level, would you expect the correlation to be weaker, stronger or about the same? Explain.
Correct Answer:
Verified
Q1: Data on Internet usage (per 100 inhabitants)
Q3: Monthly closing stock prices for a utility
Q4: The following scatterplot shows the population of
Q5: Quarterly sales figures for e-commerce retail sales
Q6: A food company launches an advertising campaign
Q7: Consider the following to answer the question(s)
Q8: Consider the following to answer the question(s)
Q9: Consider the following to answer the question(s)
Q10: Consider the following to answer the question(s)
Q11: Consider the following to answer the question(s)
Unlock this Answer For Free Now!
View this answer and more for free by performing one of the following actions

Scan the QR code to install the App and get 2 free unlocks

Unlock quizzes for free by uploading documents