Multiple Choice
The graph shows the temperature T, in degrees Fahrenheit, of molten glass t seconds after it is removed from a kiln. 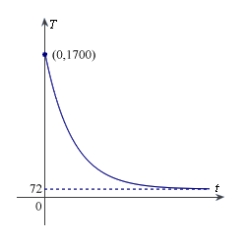 Find
Find  .
.
A) 
B) 
C) 
D) 
E) 
Correct Answer:
Verified
Related Questions
The graph shows the temperature T, in degrees Fahrenheit, of molten glass t seconds after it is removed from a kiln. Find .
A)
B)
C)
D)
E)
Correct Answer:
Verified

